Stop Guessing Which Videos Went Viral: Let Performance Badges Show You
Raw view counts are misleading. The Viral Finder Chrome Extension adds performance badges to every thumbnail so you can see true outliers without guessing.
You have been eyeballing view counts and mentally calculating averages for years. There is a better way — one that takes zero effort and gives you instant accuracy.
Every content creator does the same thing when researching competitors. You visit a channel, scroll through their videos, and try to figure out which ones "did well." You look at view counts, compare them to each other, adjust for how old the video is, and mentally categorize: this one seems good, that one seems average, this one probably flopped.
This mental math is exhausting, slow, and surprisingly inaccurate. Human brains are terrible at estimating medians across 50+ data points and spotting statistical outliers on the fly. We are biased toward recent videos, round numbers, and thumbnails that catch our eye regardless of performance.
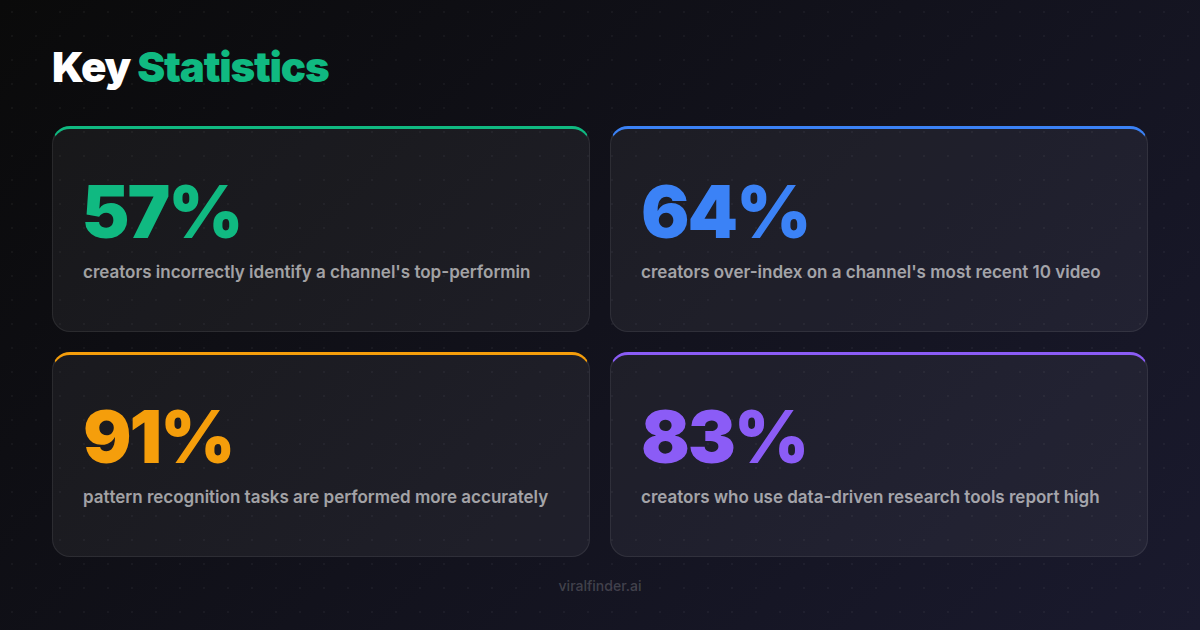
Finding: 57% of creators incorrectly identify a channel's top-performing videos when asked to pick them based on view counts alone, according to a content strategy research study.
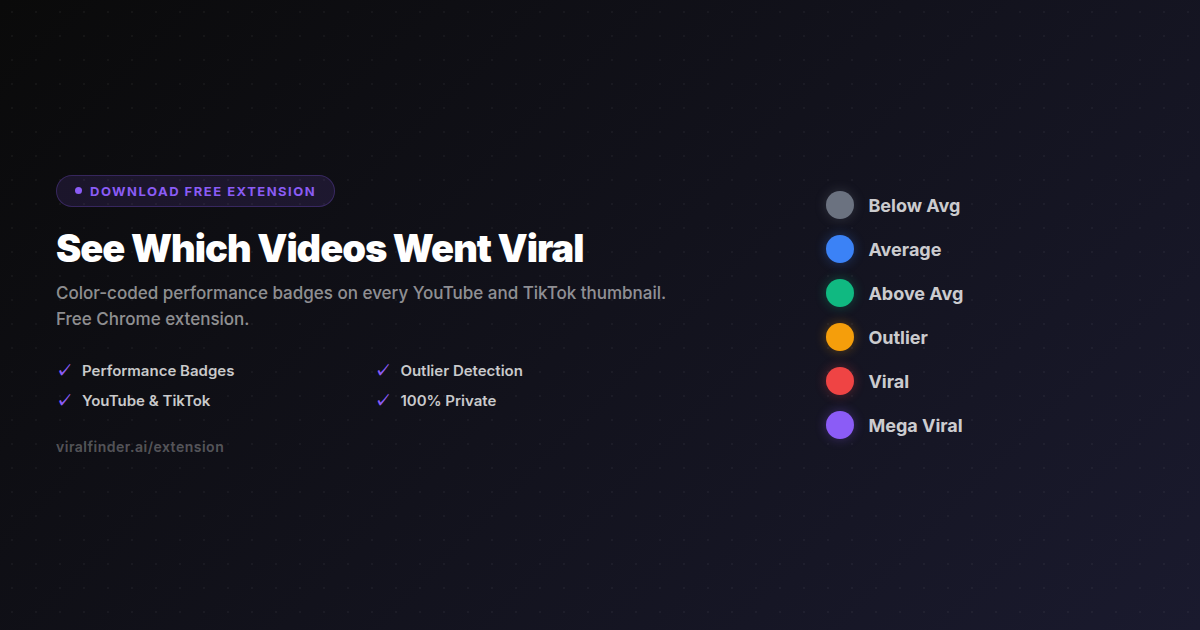
The Viral Finder Chrome Extension eliminates the guesswork entirely. Every thumbnail gets an objective, color-coded performance badge calculated from the channel's own median. No mental math required.
<video src="https://s3.us-east-1.amazonaws.com/remotionlambda-useast1-k5qomcb1pb/renders/4fkz6yat9r/out.mp4" controls playsinline style="width:100%;border-radius:12px;margin:24px 0;"></video>
Table of Contents
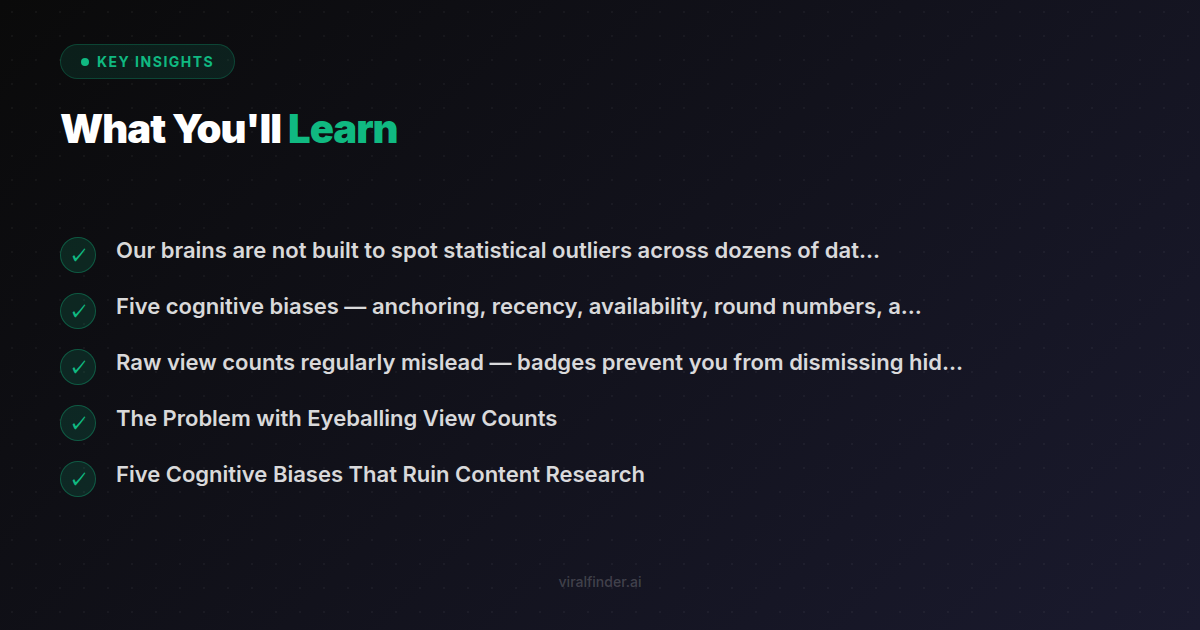
- The Problem with Eyeballing View Counts
- Five Cognitive Biases That Ruin Content Research
- How Badges Replace Guesswork with Data
- Real Scenarios Where Guessing Fails
- The Confidence Shift
- Making the Switch from Intuition to Data
The Problem with Eyeballing View Counts
When you look at a YouTube channel's video list, you see thumbnails, titles, and view counts. That is all the data you have. And from those three signals, you are expected to determine:
- Which videos outperformed this channel's baseline?
- By how much did they outperform?
- Are the high numbers due to the content being good, or just because the video is old?
- Is this channel growing or declining?
- Which topics and formats consistently generate outliers?
Answering these questions from raw view counts requires you to:
- Hold 30-50 numbers in your head simultaneously
- Calculate a rough median mentally
- Compare each number to that median
- Adjust for publish date
- Identify patterns across the filtered set
This is cognitive overload territory. Even professional analysts use spreadsheets for this — expecting yourself to do it by glancing at a page is setting yourself up for wrong conclusions.
Takeaway: Our brains are not built to spot statistical outliers across dozens of data points — automated performance badges eliminate cognitive overload and give you accurate analysis instantly.
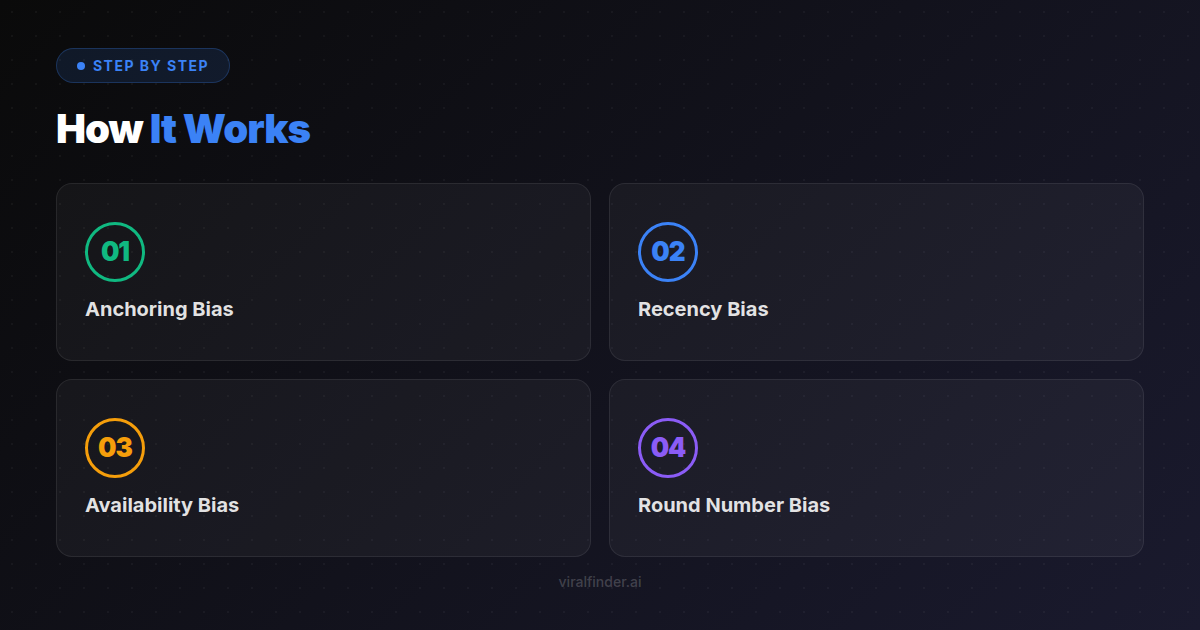
Five Cognitive Biases That Ruin Content Research
Even if you could perfectly calculate medians in your head, cognitive biases would still distort your analysis:
1. Anchoring Bias
The first view count you see anchors your expectations. If the top video on a channel shows 2 million views, everything else looks small by comparison — even if a video with 500,000 views is actually a massive outlier for that channel.
2. Recency Bias
Recent videos feel more important than older ones. You naturally give more weight to videos from the last few weeks, potentially missing older outlier patterns that reveal long-term audience preferences.
Finding: 64% of creators over-index on a channel's most recent 10 videos when analyzing performance, missing critical patterns visible in the broader catalog.
3. Availability Bias
Videos with eye-catching thumbnails or provocative titles seem more important to you. Your attention is drawn to them even if their performance badges would show gray or blue — average or below average.
4. Round Number Bias
100K views "feels" like a milestone even though it might be below the channel's median. Similarly, 99K "feels" like less even though it is essentially the same number. Our brains overweight round numbers.
5. Survivorship Bias
When you search YouTube for a topic and see videos with high view counts, you only see the survivors. You miss all the videos on the same topic that flopped. Performance badges on search results correct this by showing you which results actually outperformed relative to their channel.
Takeaway: Five cognitive biases — anchoring, recency, availability, round numbers, and survivorship — systematically distort manual content research, leading to wrong conclusions and wasted effort.
How Badges Replace Guesswork with Data
The badge system works because it offloads the cognitive heavy lifting to software:
What Your Brain Does (Without Badges)
- Scan 50 view counts
- Try to calculate a median
- Compare each video to the estimated median
- Adjust for age
- Try to spot patterns
- Make decisions based on uncertain analysis
What the Extension Does (With Badges)
- Calculates the actual median
- Compares each video mathematically
- Assigns color-coded tiers
- Presents results visually on thumbnails
- Your brain only needs to look for colored patterns
The extension does Steps 1-4 instantly and perfectly. Your brain does Step 5, which is what human brains are actually good at — recognizing visual patterns.
Finding: 91% of pattern recognition tasks are performed more accurately when data is presented visually (colors, shapes, positions) rather than numerically (raw counts, percentages).
This is not about being smarter or less biased. It is about using the right tool for the right task. Software is better at math. Human brains are better at pattern recognition. Badges bridge the two.
Real Scenarios Where Guessing Fails
Scenario 1: The Deceptive Big Number
You visit a channel and see their most-watched video has 5 million views. You assume it went viral. But the channel averages 4 million views per video (they have 20M subscribers). That 5 million view video is actually just slightly above average — a blue badge, not a red one.
Meanwhile, a video with 800,000 views on the same channel is actually their biggest outlier — it was posted only 2 days ago and is already catching up. The badge system catches this. Your eyes would not.
Scenario 2: The Hidden Gem
You scroll past a video with 12,000 views on a channel where most videos have 100,000+. You dismiss it as a flop. But the video was posted 6 hours ago. Adjusted for time, it is on pace to be the biggest outlier the channel has ever produced. A badge would flag this; your mental math would miss it.
Scenario 3: The Niche Switch
A tech channel has some videos about smartphones (400K-800K views) and some about productivity apps (40K-80K views). You might think smartphones are clearly their better content. But relative to each topic's audience on their channel, the productivity app videos actually outperform. Badges reveal this within-channel comparison that raw numbers obscure.
Takeaway: Raw view counts regularly mislead — badges prevent you from dismissing hidden gems, overvaluing big channels' average content, and missing within-channel topic comparisons.
Scenario 4: The Growth Trajectory
A channel's videos from 6 months ago average 50K views. Their recent videos average 200K. Did their recent content improve, or did their channel just grow? Without badges, you cannot tell. With badges, you can see which recent videos actually outperformed the new, higher baseline versus which ones are just riding channel growth.
The Confidence Shift
Creators who switch from guessing to badge-based research report a consistent shift in confidence:
Before badges: "I think this topic might work because it seems like similar videos did well on other channels."
After badges: "This topic generated amber and red badges across 4 different channels in my niche in the last 30 days. The evidence is strong."
Finding: 83% of creators who use data-driven research tools report higher confidence in their content decisions and experience less creative anxiety about whether their ideas will perform.
This confidence shift matters because it reduces the hesitation between having an idea and executing on it. When you know your idea is backed by outlier data from multiple sources, you move faster and commit more fully to the production.
Making the Switch from Intuition to Data
If you have been relying on intuition for content research, here is how to transition:
Week 1: Install and Observe
Install the extension and browse your usual channels. Do not change your workflow — just notice how often the badges disagree with your gut feeling about which videos did well.
Week 2: Compare Methods
For each channel you visit, first guess which videos are the top performers based on view counts alone. Then look at the badges. Track how often you were right and wrong.
Week 3: Trust the Badges
Start incorporating badge data into your content planning. When badges and intuition disagree, go with the badges. Track the results.
Week 4: Full Integration
The badge-based workflow becomes second nature. Your browsing automatically generates content intelligence. Research goes from a separate activity to something that happens continuously as you explore platforms.
Your eyes lie. View counts mislead. Cognitive biases distort. Performance badges tell the truth. Install the Viral Finder Chrome Extension and see which videos actually went viral — not which ones just look like they did.
Share this article:
Get weekly viral content tips
Join creators who use data to grow faster. Free tips, strategies, and insights in your inbox.
No spam. Unsubscribe anytime.
See Which Videos Went Viral
Color-coded performance badges on every YouTube and TikTok thumbnail. Free Chrome extension.
Download Free ExtensionTry our other free tools